Screenshots
The unfirehose dashboard running locally. Every session, every thought thread, every token — captured and visualized.
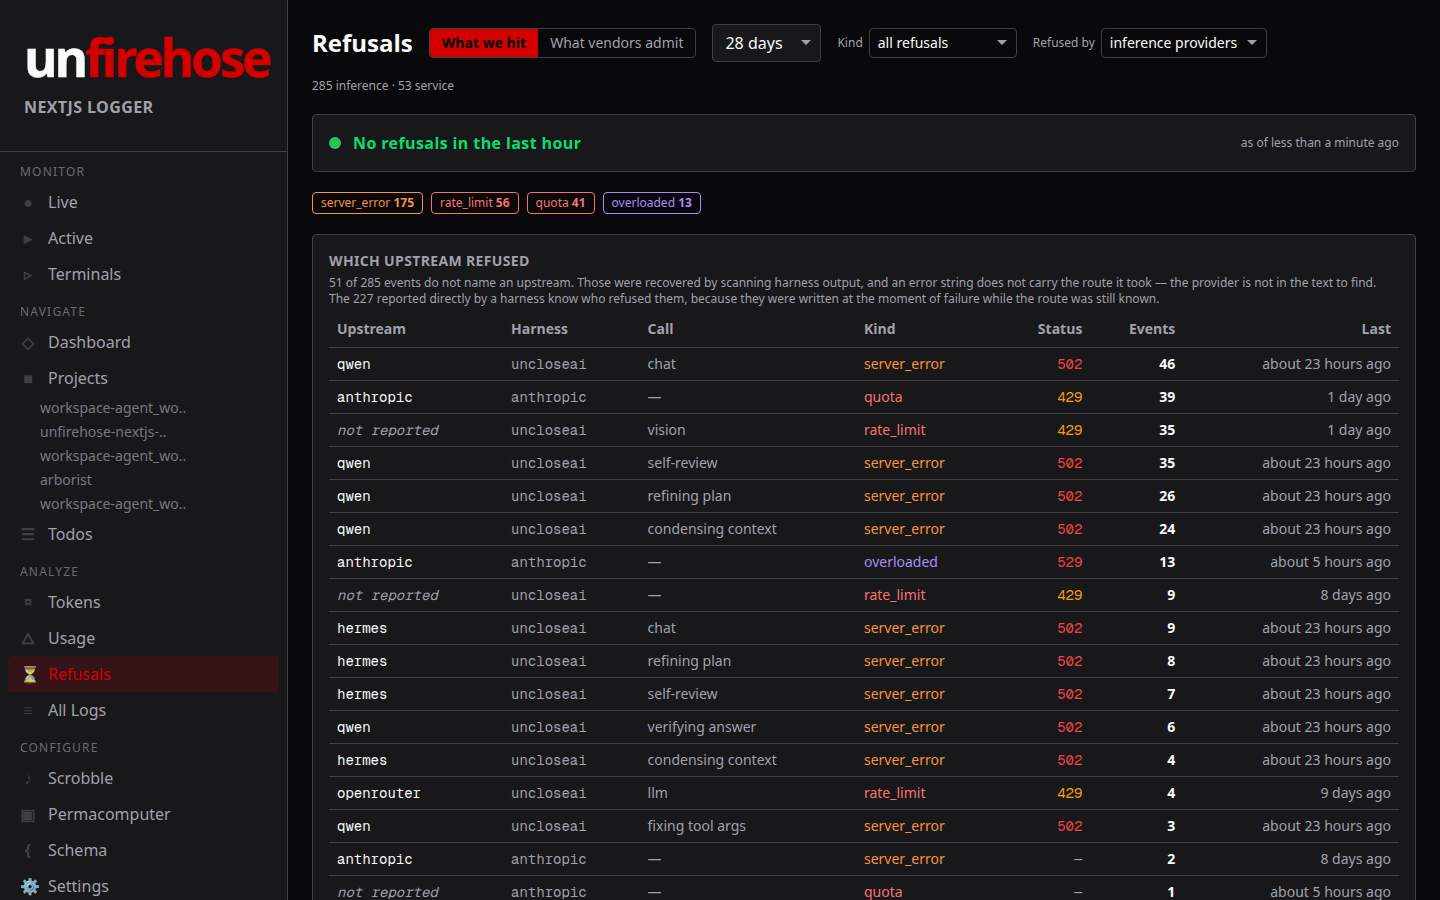
Refusals
What is being refused right now and over any window: throttles, quota, overloads, 5xx, by harness and by the upstream that said no.
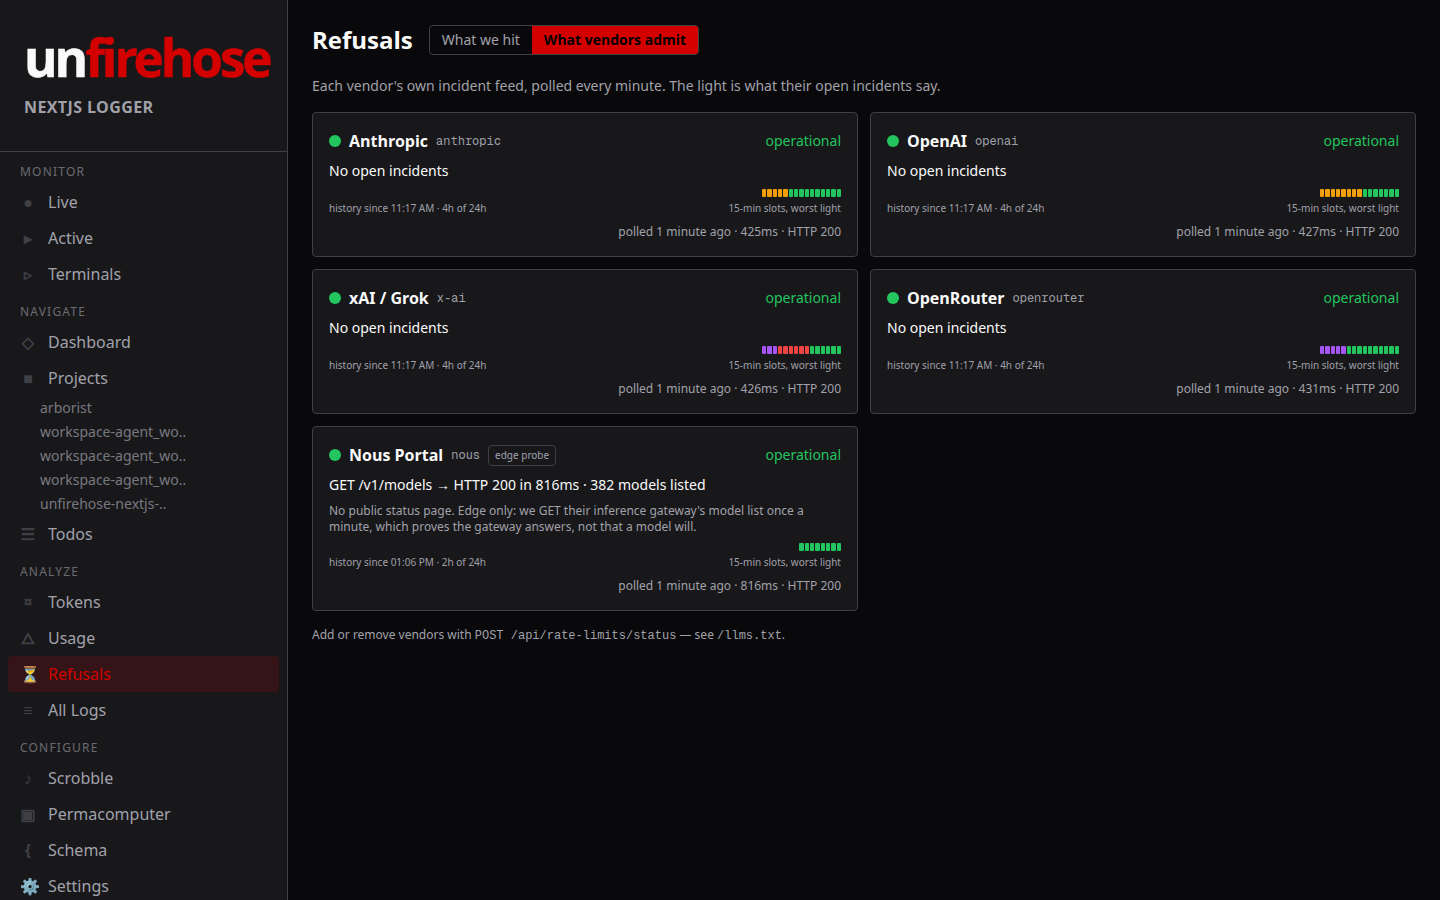
What Vendors Admit
Each provider's own incident feed, polled every minute, beside your refusal counts. Us or them, one glance.
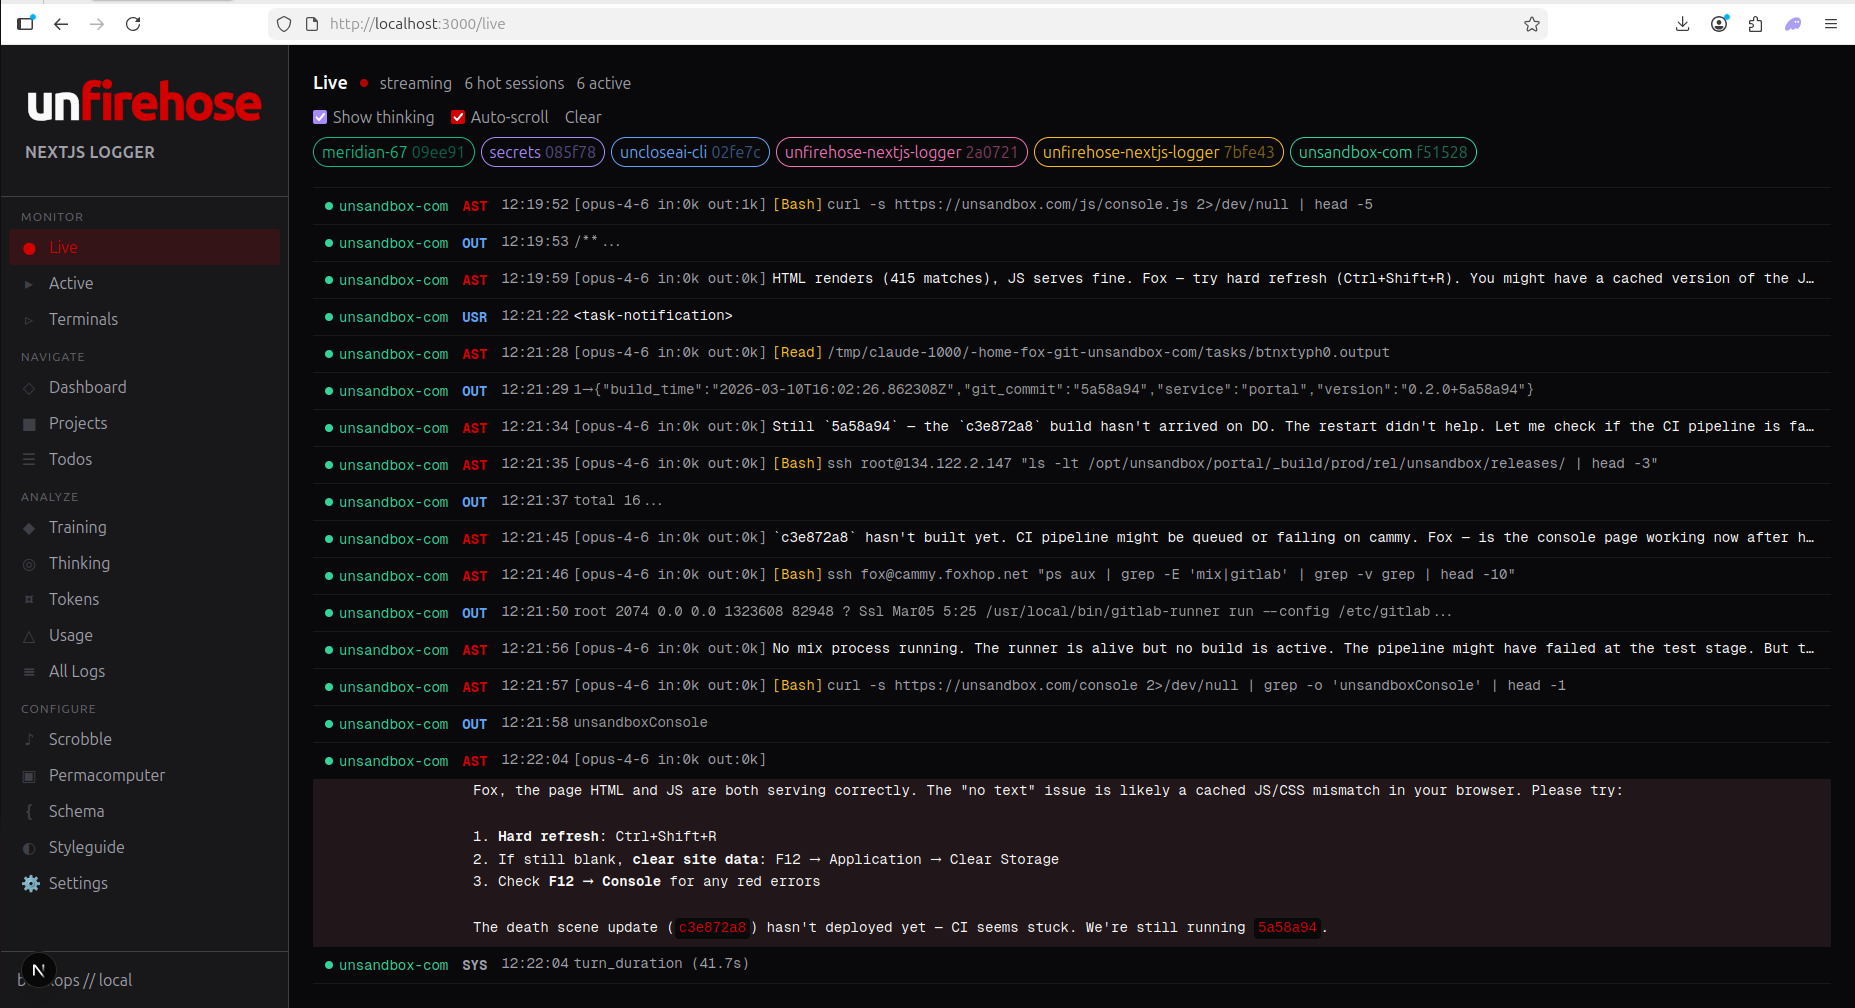
Live Feed
Real-time streaming of agent sessions. Watch thought tokens, tool calls, and diffs as they happen across all harnesses.
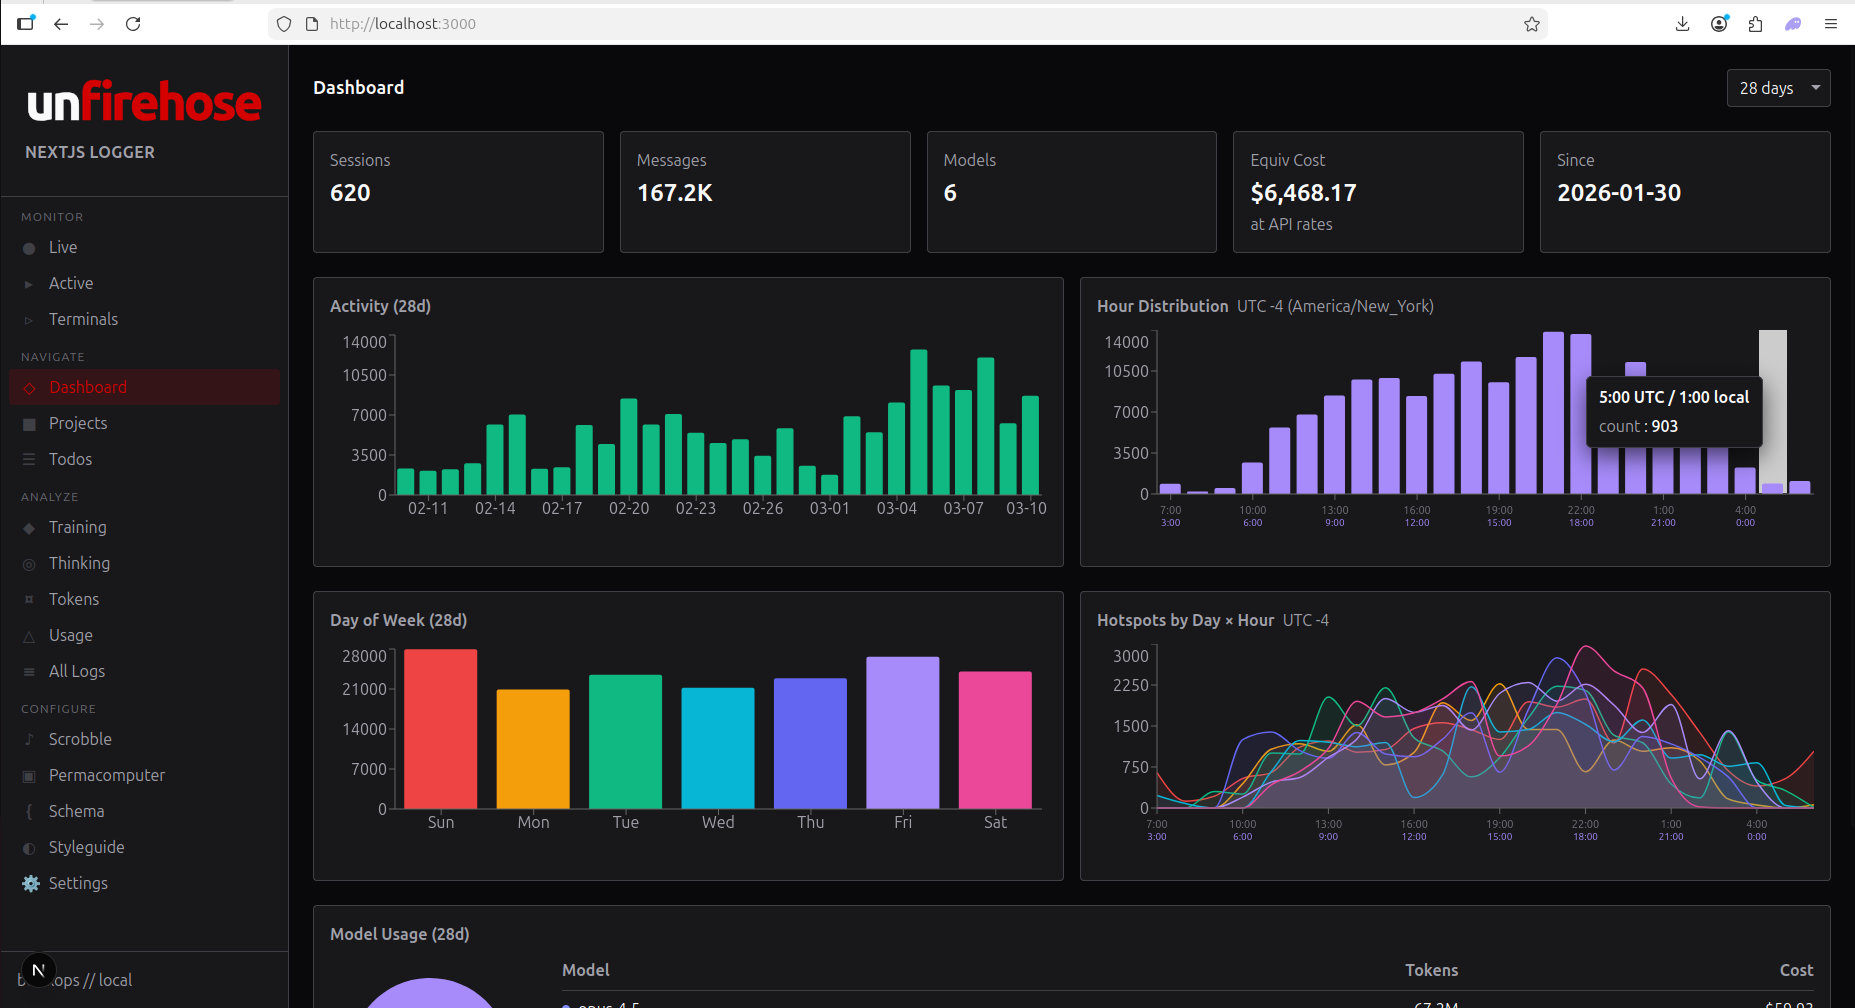
Dashboard
Activity overview with session counts, token totals, equivalent cost, hourly distribution, and day-of-week heatmaps.
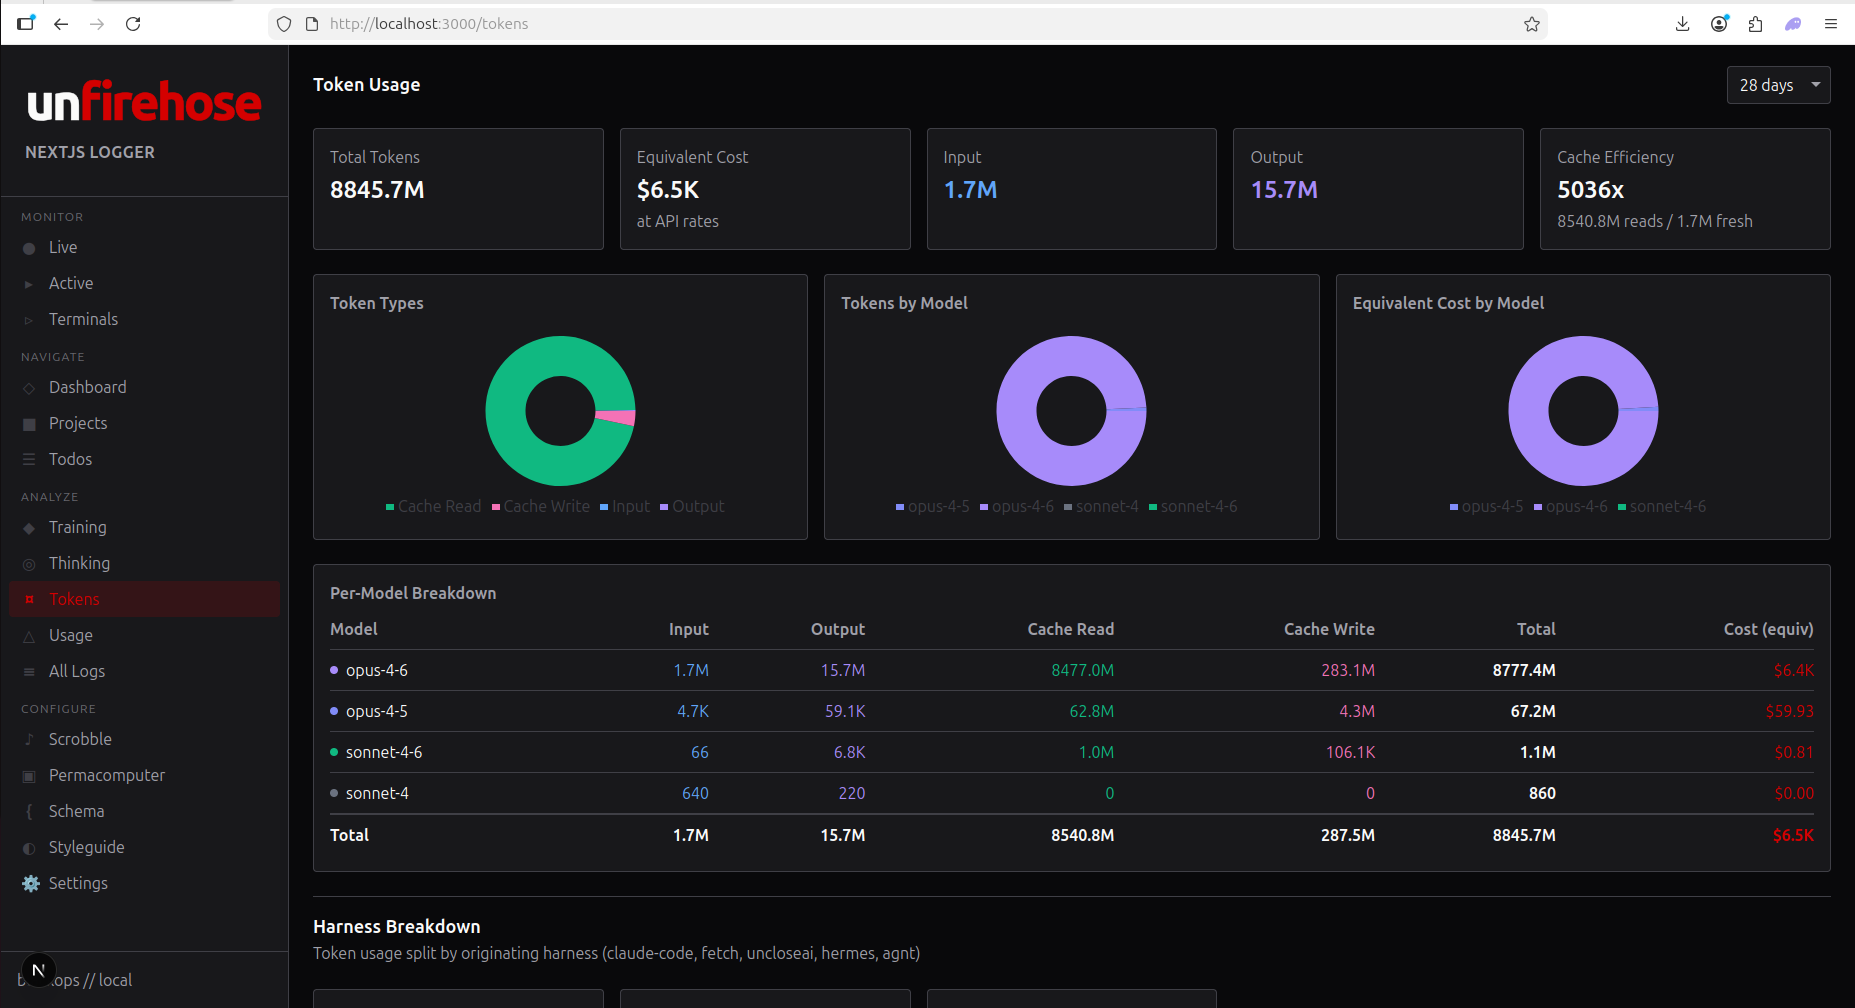
Tokens
Cost split by input, output, cache read and cache write, priced from a public price book. Prefix-cache hit rates from your own inference nodes.
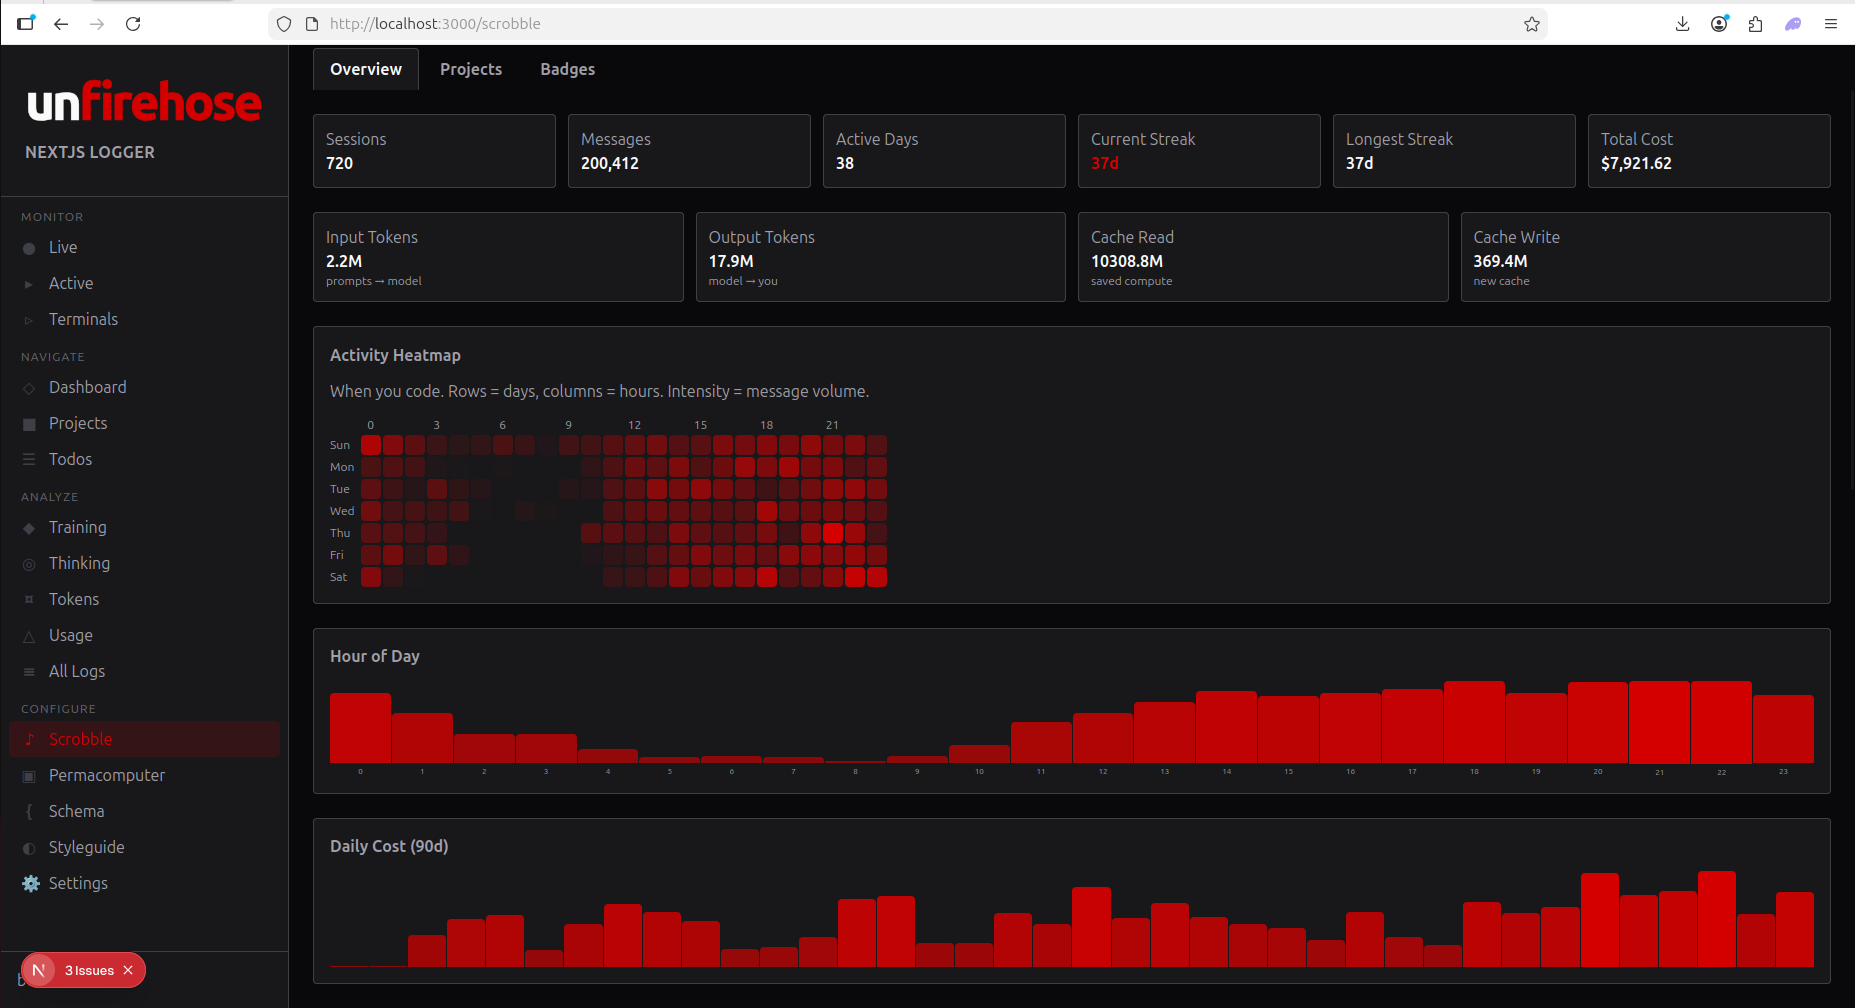
Scrobble
Like Last.fm for code. Activity heatmap, hour-of-day distribution, daily cost, streak counter, and lifetime stats.
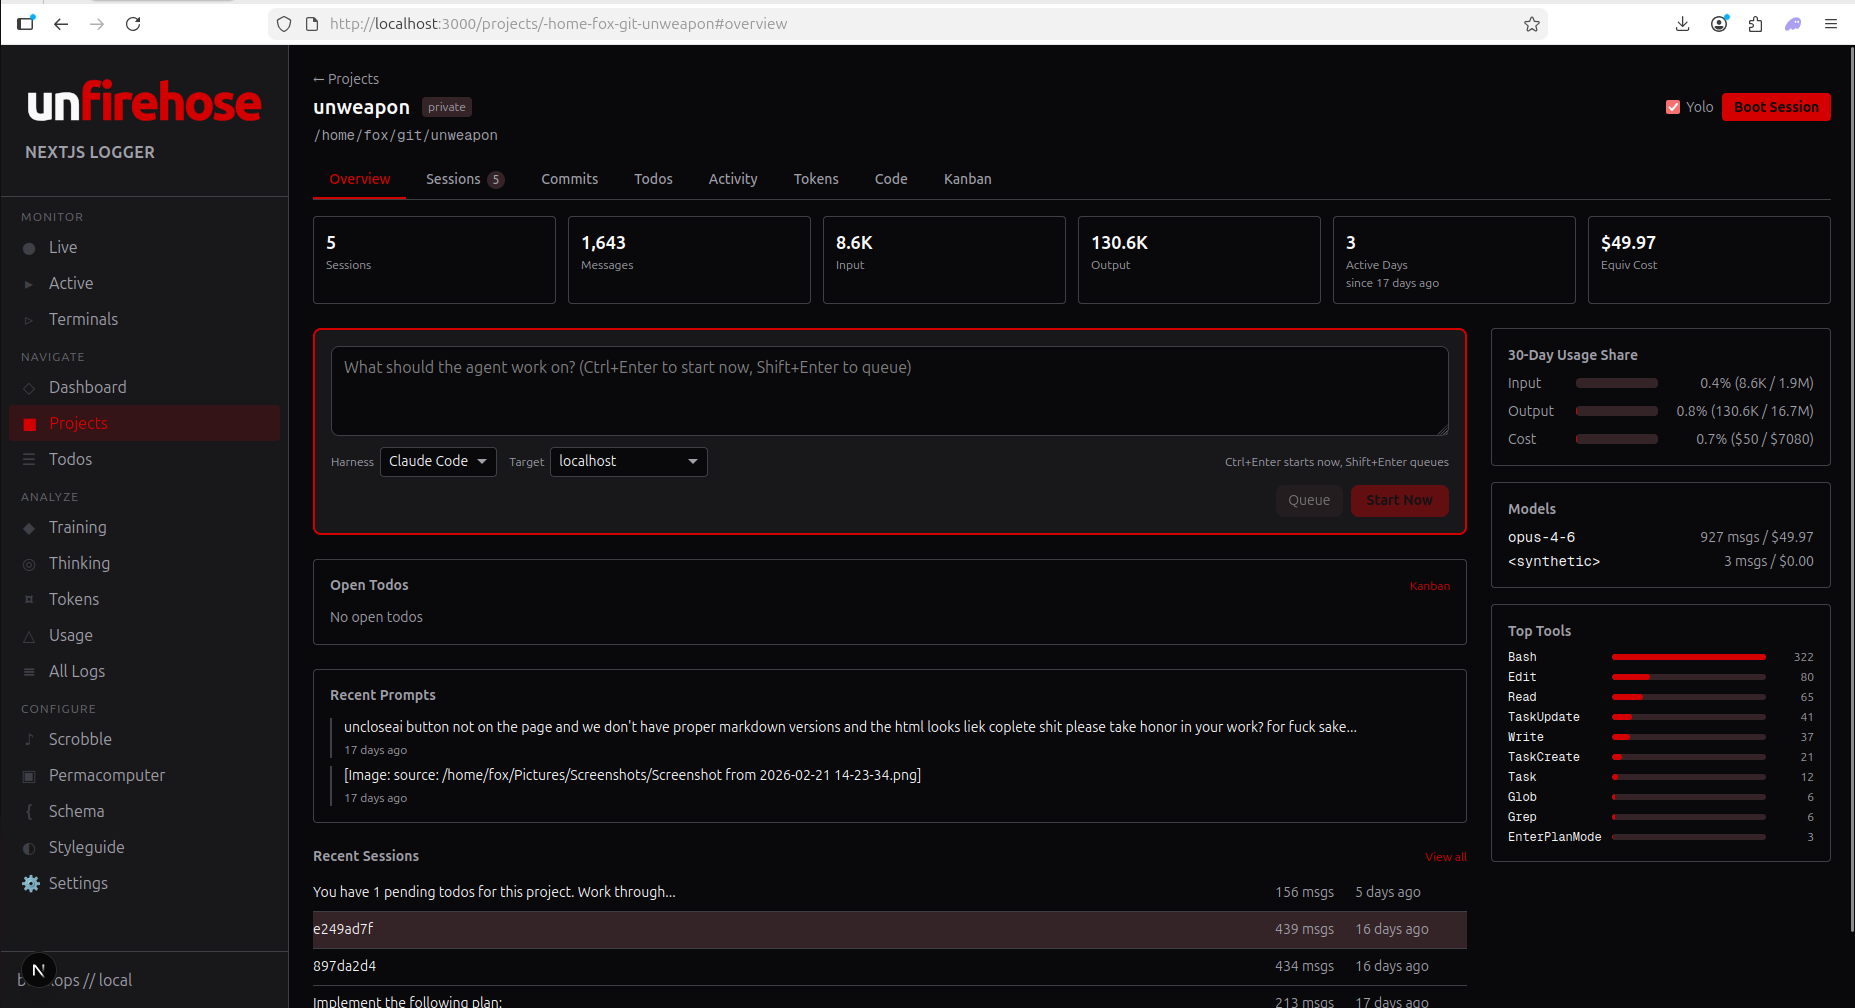
Project Detail
Per-project overview: sessions, commits, todos, cost by model, top tools, and a prompt box to boot an agent on it.
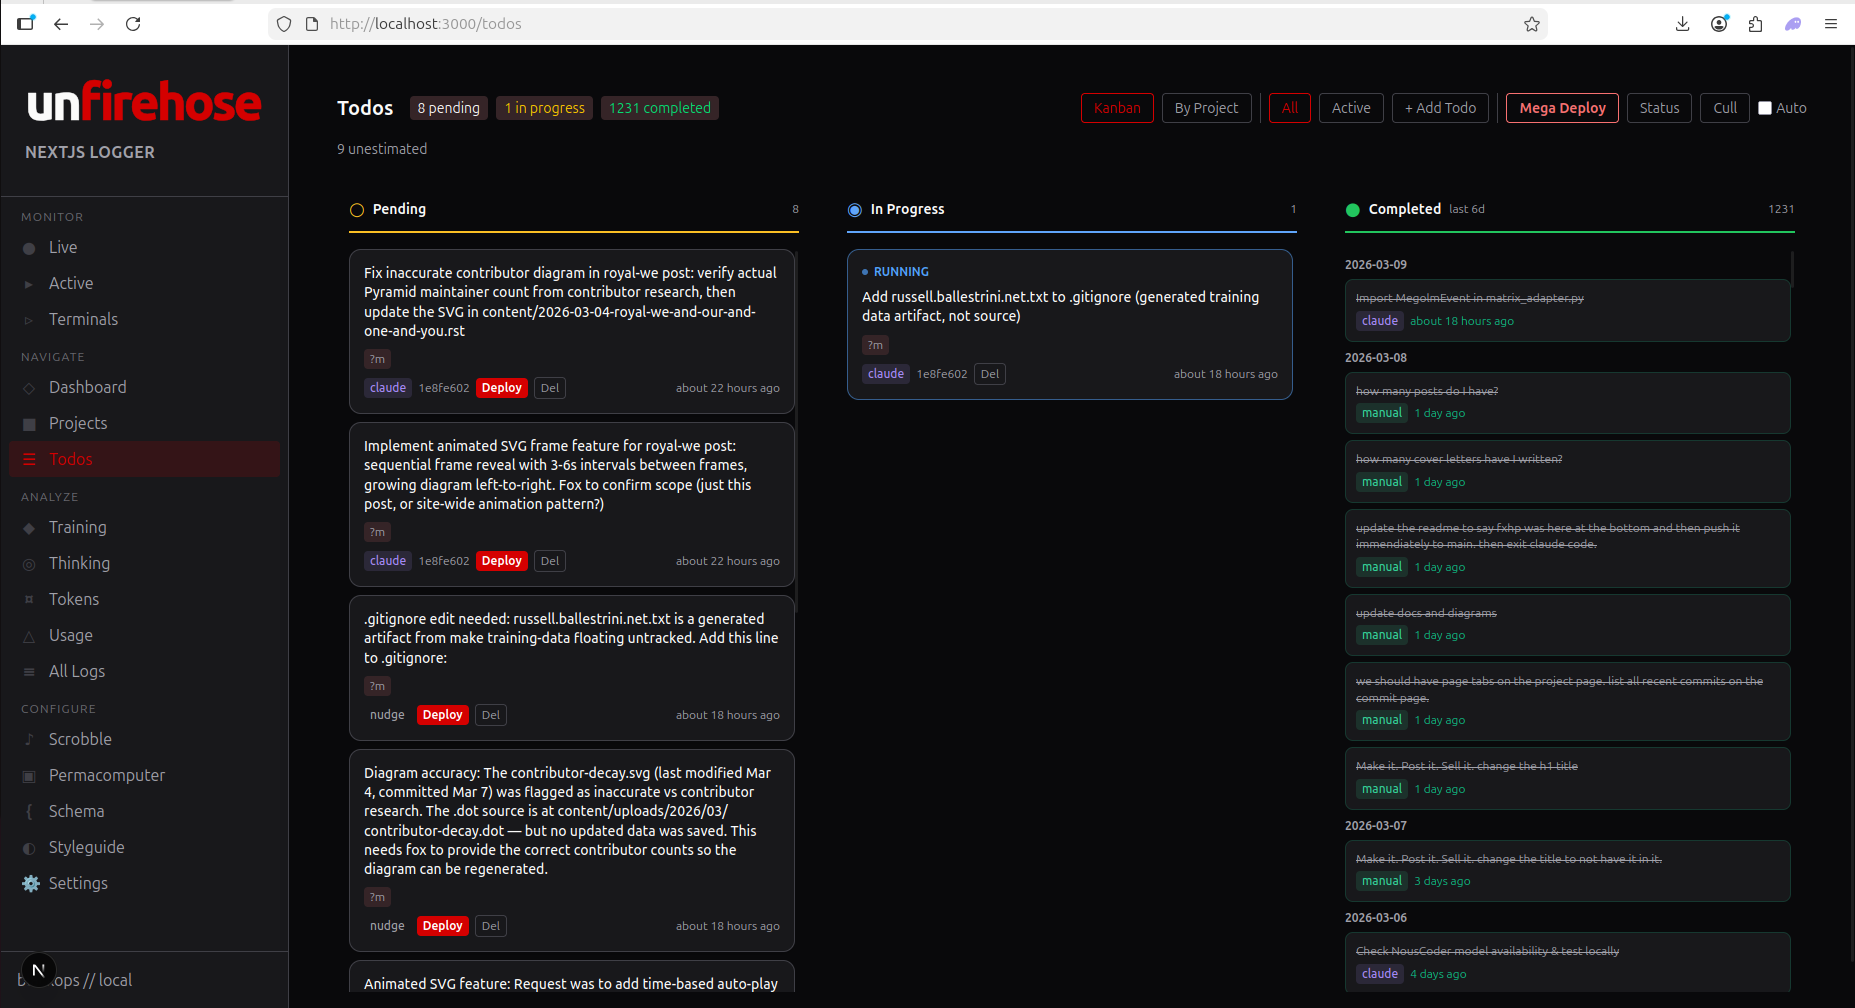
Todo Kanban
Cross-session todos extracted from every agent conversation. Pending, in-progress, and completed lanes.
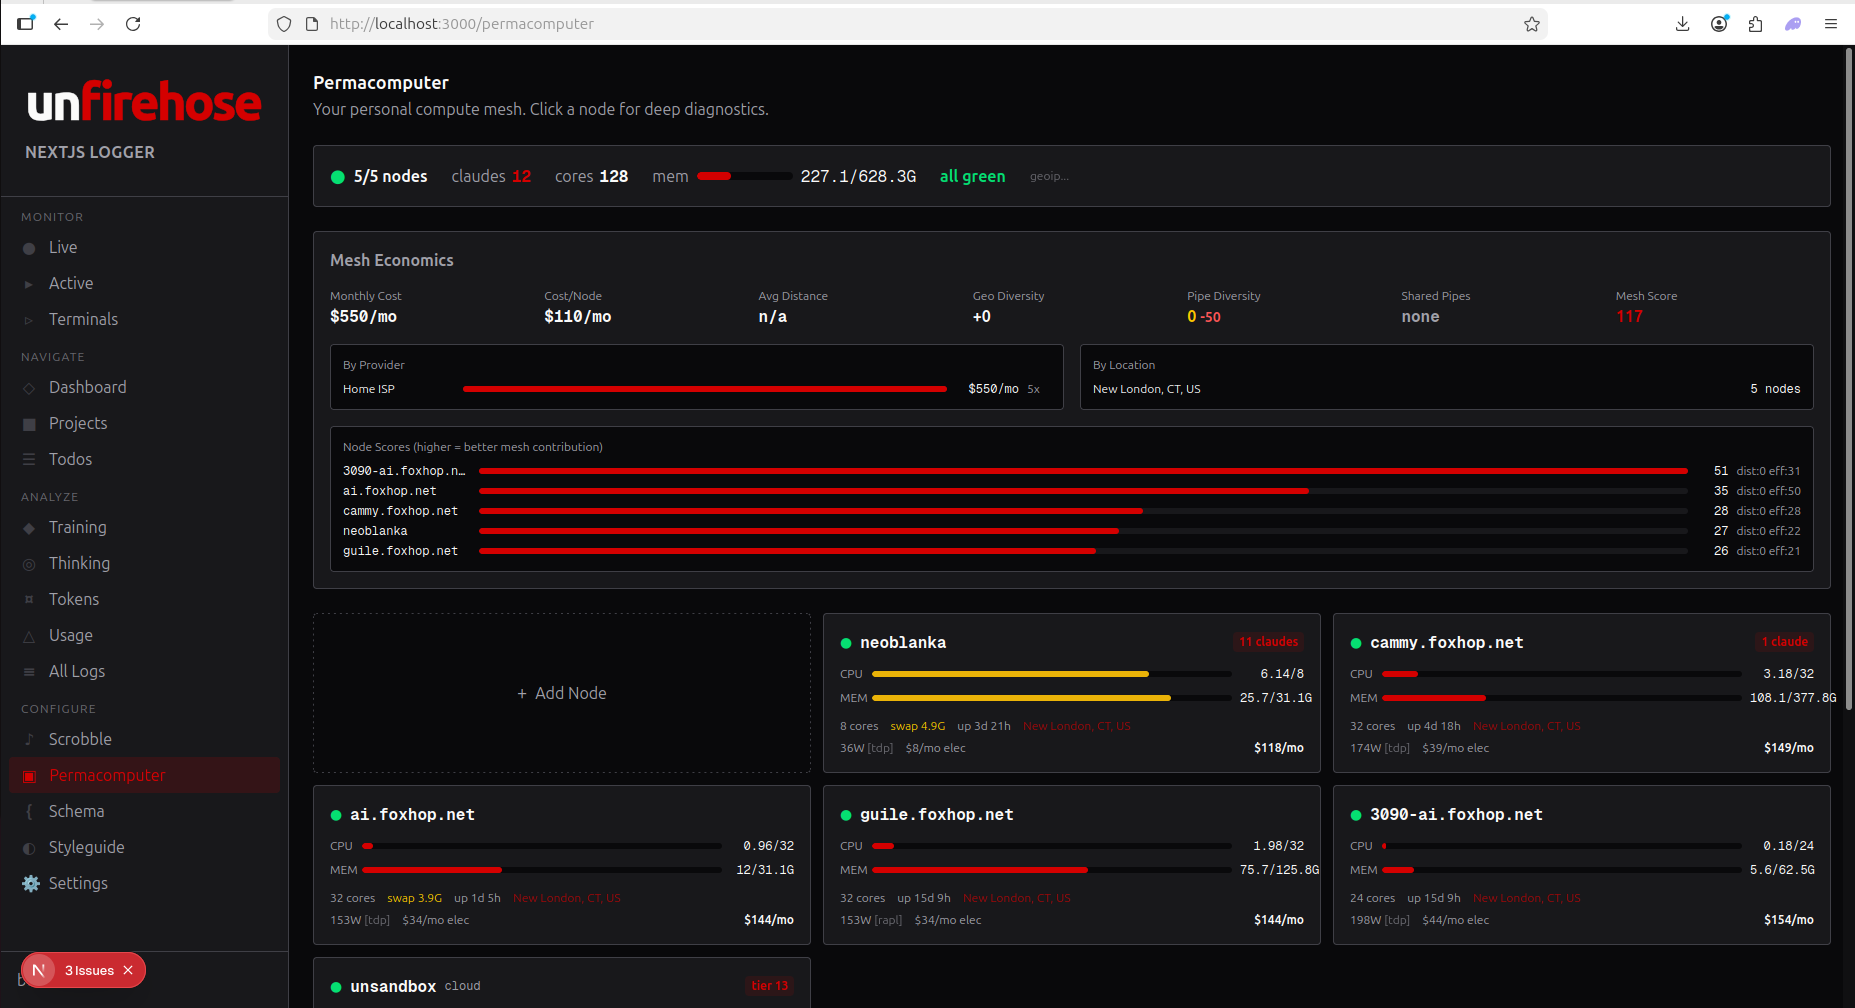
Permacomputer
Mesh node overview. CPU, memory, GPU, power draw and electricity cost across your compute fleet.
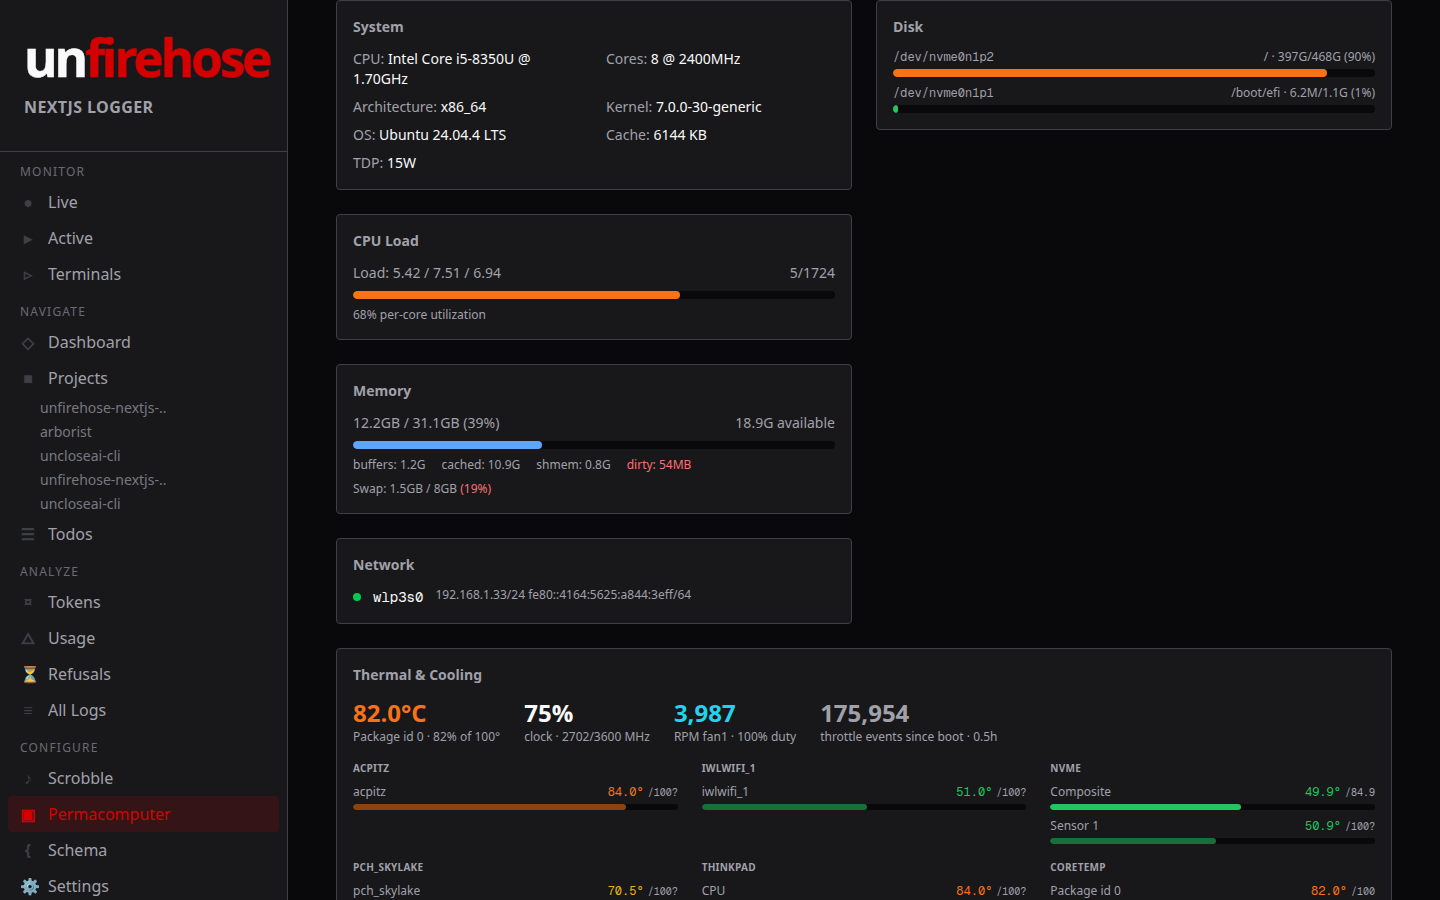
Node Detail
Every sensor a machine will admit to: package temperature, fan duty, clock against its rated speed, and throttle events counted since boot. A laptop cooking at 82°C is doing your work badly and only this page says so.
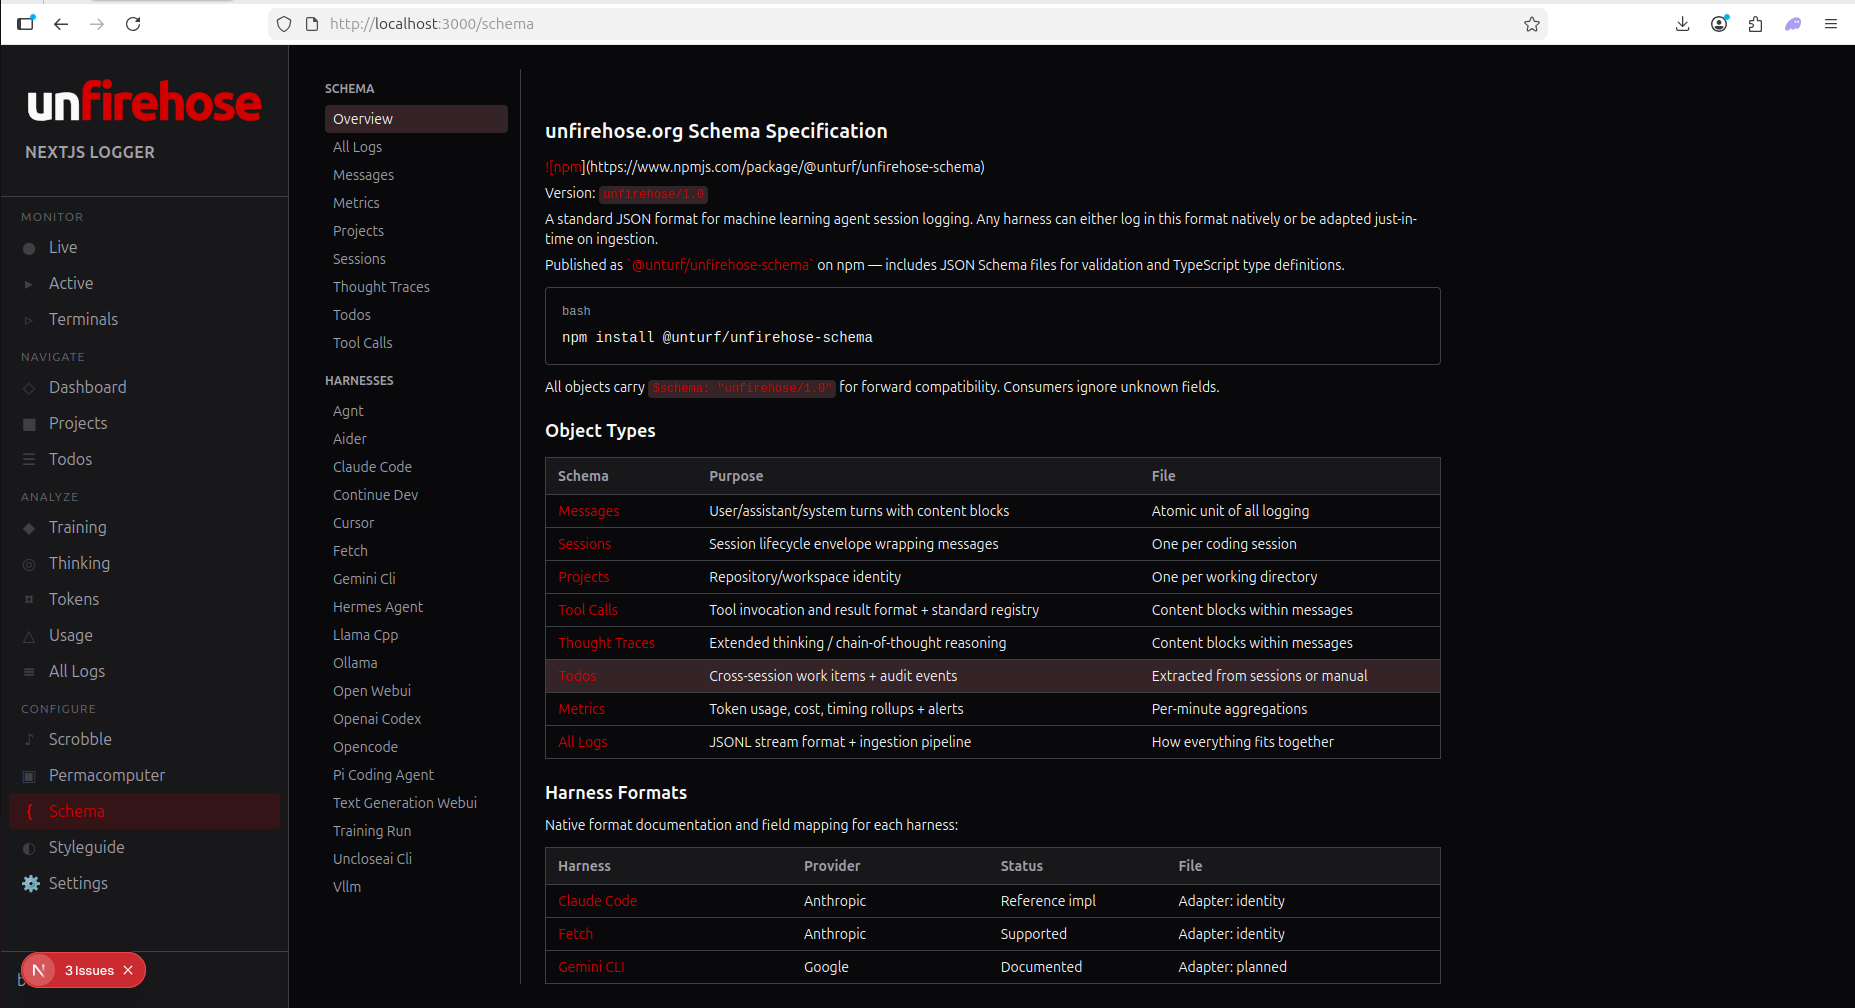
Schema Spec
The unfirehose/1.0 specification. Object types and 18 harness adapters, the standard that connects every coding agent.
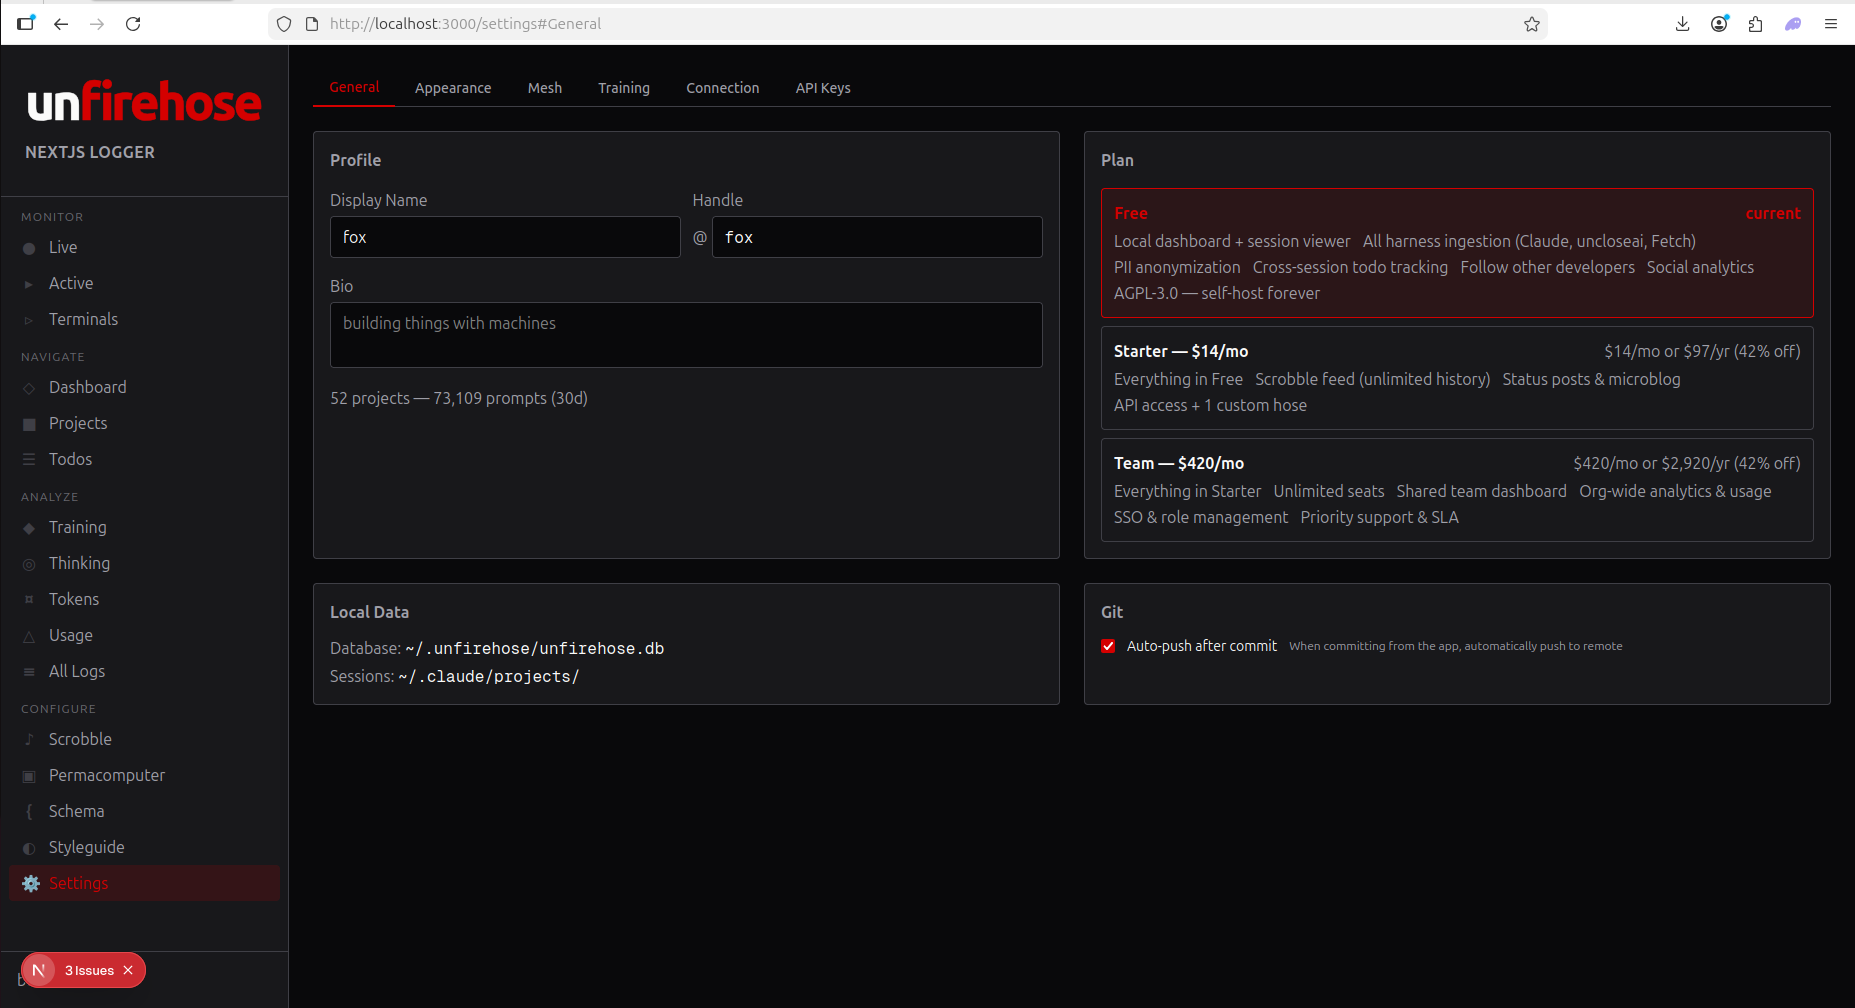
Make It Yours
Any accent colour you like, with a tonal scale derived from it, and forty currencies to read your costs in. No account, no telemetry, nothing leaves the machine.
See It Running
Free. Open source. AGPL forever. Self-host in 60 seconds.